


After testing well over 100 thermal pastes, today we have a real upgrade! In today’s presentation of the new database version 3.0, I will explain why the evaluation of thermal pastes based on a simple CPU measurement is often misleading. I will also show why the TIMA5 has been fundamentally improved once again and why the content of the database has been completely restructured. Many supposedly precise temperature comparisons on the Internet are usually based on measured values whose differences are smaller than the unavoidable tolerances of the entire setup. Of course, this is exactly what I want to avoid.
I have been criticized more than once for my measurements being too academic and far removed from practice, which is not true, but could certainly appear that way to outsiders. This is precisely why I have spent the last few weeks trying to make my measurements not only more accurate, but also more transparent and practice-oriented and, above all, to present them in the database and articles in a much more comprehensible way. After all, what good is the best measurement data if the graphical statement does not convey what anyone can immediately recognize, even without an engineering degree? Nothing!
Even slight variations in the application of the paste, in the contact pressure or in the exact position of the temperature sensor can produce temperature deviations that are greater than the real effect of the different thermal conductivities. This is how measurement errors become apparently reliable results, and random deviations result in diagrams that depict more chance than physics. Pure CPU measurements, usually with only a single run, but with decimal places in the charts are perhaps quite entertaining, but actually fundamentally wrong and even misleading.
And just as an aside: I hope we’ll soon break the 5 million hits mark:

Systemic errors of classic CPU measurements with heatspreader
The exemplary graphic clearly shows why classic thermal paste comparisons on CPUs with heat spreaders contain a systemic measurement error. The temperature differences of a Ryzen 9 9950X at around 230 watts are in the range of a few Kelvin, which appears precise at first glance, but is actually a fundamental fallacy.
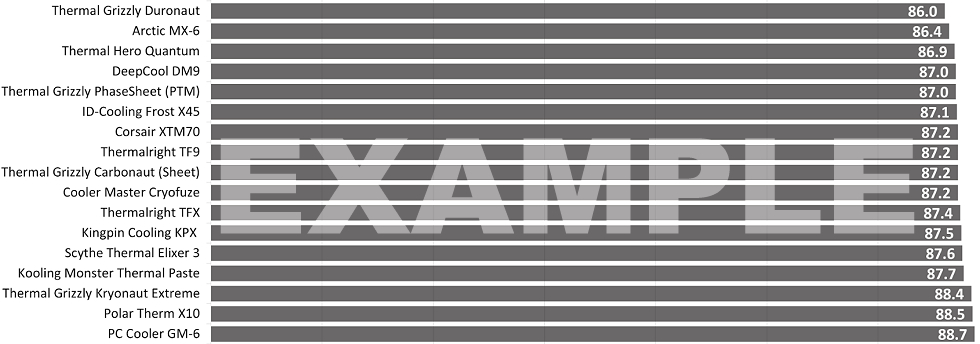
A CPU with a heatspreader has a completely serial thermal resistance chain from the silicon via the internal TIM and the copper-nickel IHS to the external paste and into the cooler. The largest resistance components are inside the processor and cannot be influenced. The external TIM component is only a small fraction of the total resistance, which is why differences in high-quality pastes at 230 watts are often reflected in less than one Kelvin. Such differences are within the system-related inaccuracy of a single application and are visually masked by the bar graph.
If the actual thermal resistance is determined correctly after many cycles, a different and physically consistent ranking results. In practice, the first eight pastes only differ by around 0.3 Kelvin on the CPU, which shows that the frequently quoted bulk thermal conductivity is hardly meaningful for real applications. The only decisive factor is the effective thermal resistance, including the contact surfaces.
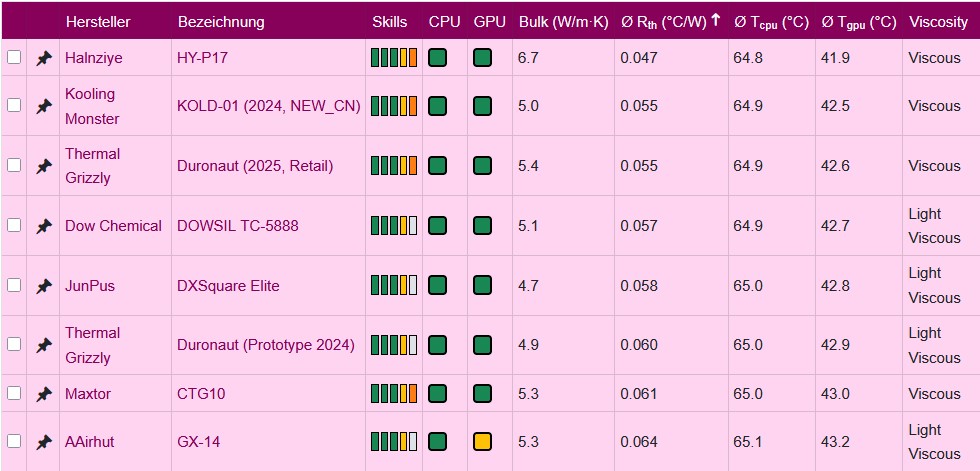
The new database interface therefore primarily uses the measured Rth and the temperatures derived from it for a Ryzen 7 9700X with 125 watts and an RTX 4090 with 450 watts, which are explained in detail in the article. The bars of classic comparison tests suggest an accuracy that is physically untenable. Even minimal deviations in layer thickness, contact quality, contact pressure, micro-roughness or the internal variance of the heatspreader change the result more than the material difference of the pastes. The seemingly fine resolution of the diagrams is therefore misleading, as the measurement cannot show the decimal places shown. In reality, the differences shown are within the usual scatter of a single order. The ranking list therefore reflects random influences rather than the actual performance of the pastes. This is not the fault of the tester, but shows that such comparisons are hardly useful as a technical reference.
Comparison with direct die and GPU measurements
In the direct-die and GPU measurements described later, the heat spreader is omitted or was never present, which is why the external paste takes on a significantly larger share of the total thermal resistance. The thermal chain is shorter, the convective component remains constant, and the TIM resistance shapes the behavior of the entire path from the silicon to the water. As a result, even small differences in Rth,TIM become measurable because they are no longer superimposed by internal CPU structures. In GPUs and direct-die configurations, the heat flux densities are high and the proportion of the paste in the total resistance is large, which is why temperature differences have a clear physical basis and are reproducible. Only then can real rankings be formed, as neither series dispersion of the heatspreader nor internal TIM components distort the result. The actual performance of a paste can only be seen directly on the silicon.
That’s why I make a strict distinction between CPU and GPU scenarios in the article. Desktop CPUs such as a Ryzen processor work with relatively moderate power losses and large heat distribution structures. The heatspreader on the Ryzen 9 9950X, for example, has an area of around 840 mm², distributes the heat evenly and reduces the heat flux density. Under such conditions, temperature differences between pastes are usually in the range of one Kelvin and therefore within the measurement uncertainty, as the path is dominated by the IHS and cooler base and the paste only makes a small contribution.
A high-end GPU or even a CPU without a heat spreader, on the other hand, works with significantly higher heat flows and smaller effective contact surfaces. An RTX 5090 can dissipate up to 600 watts directly via a die area of around 750 mm², which greatly increases the heat flow density and significantly increases the influence of the paste. It is only in this area that differences between pastes become clearly visible, because they contribute a relevant proportion of the temperature rise.
The article therefore considers all three scenarios separately and shows how closely the importance of the paste is linked to the contact area and the power dissipation. A paste that is hardly measurably better on a CPU can bring several Kelvin advantage on a GPU because the heat flow there is many times higher. This is exclusively about heat dissipation under controlled conditions and the realization that simple CPU measurements are only of very limited use for evaluating thermal performance.
Why thermal conductivity alone says nothing at all
The difference between the bulk thermal conductivity λ and the real total thermal resistance Rth total is that λ only describes the material, while Rth total represents the entire thermal path. The bulk thermal conductivity is obtained under ideal laboratory conditions with smooth surfaces and large sample thicknesses. In a real system, however, additional contact resistances occur between die, paste and cooler, which often have a greater effect than the material resistance itself.
The actual thermal conductivity results from the sum of all serial resistances. A paste can therefore be nominally very conductive without achieving this performance in practical contact. Layer thickness, contact pressure, surface structure and compaction determine the effective thermal resistance much more than the pure material constant. The bulk thermal conductivity is therefore only a theoretical upper limit and not a reliable criterion for evaluating a paste. The decisive factor is how much heat the entire system can actually transfer per Kelvin, i.e. the behavior of the entire path from the silicon to the cooling medium.
Equipment and database upgrade to 3.0
The measurement results from the example graphic above have shown that simple temperature evaluations for thermal pastes do not provide a sufficiently precise basis for an objective assessment. The temperature differences determined between different pastes are often in the range of the measurement scatter, so that it is hardly possible to draw reliable conclusions about the actual performance from this data alone. For this reason, the existing thermal paste database will soon receive a comprehensive upgrade, as it is also my declared aim to make the measurements much more precise and practical by systematically evaluating the thermal resistances separately according to real application scenarios. Instead of a blanket temperature specification, several standardized test conditions will be taken into account in the future, which represent typical CPU and GPU setups. It was already more accurate than most other publicly available comparison lists, but it still wasn’t enough for me.
The extended measurement concept that I am presenting to you today also takes the actual heat flux density, i.e. the ratio of waste heat to the effective contact surface, into account for the first time. It is precisely this parameter that determines how strongly a paste affects the temperature and which physical limits are relevant at all. The upcoming upgrade of the database will therefore not only provide more precise values, but also create a realistic guide for users. In future, anyone looking for the optimum paste will be able to see for which combination of surface area, performance and structure a particular product actually makes sense and when expensive high-end pastes are of little benefit in practice.
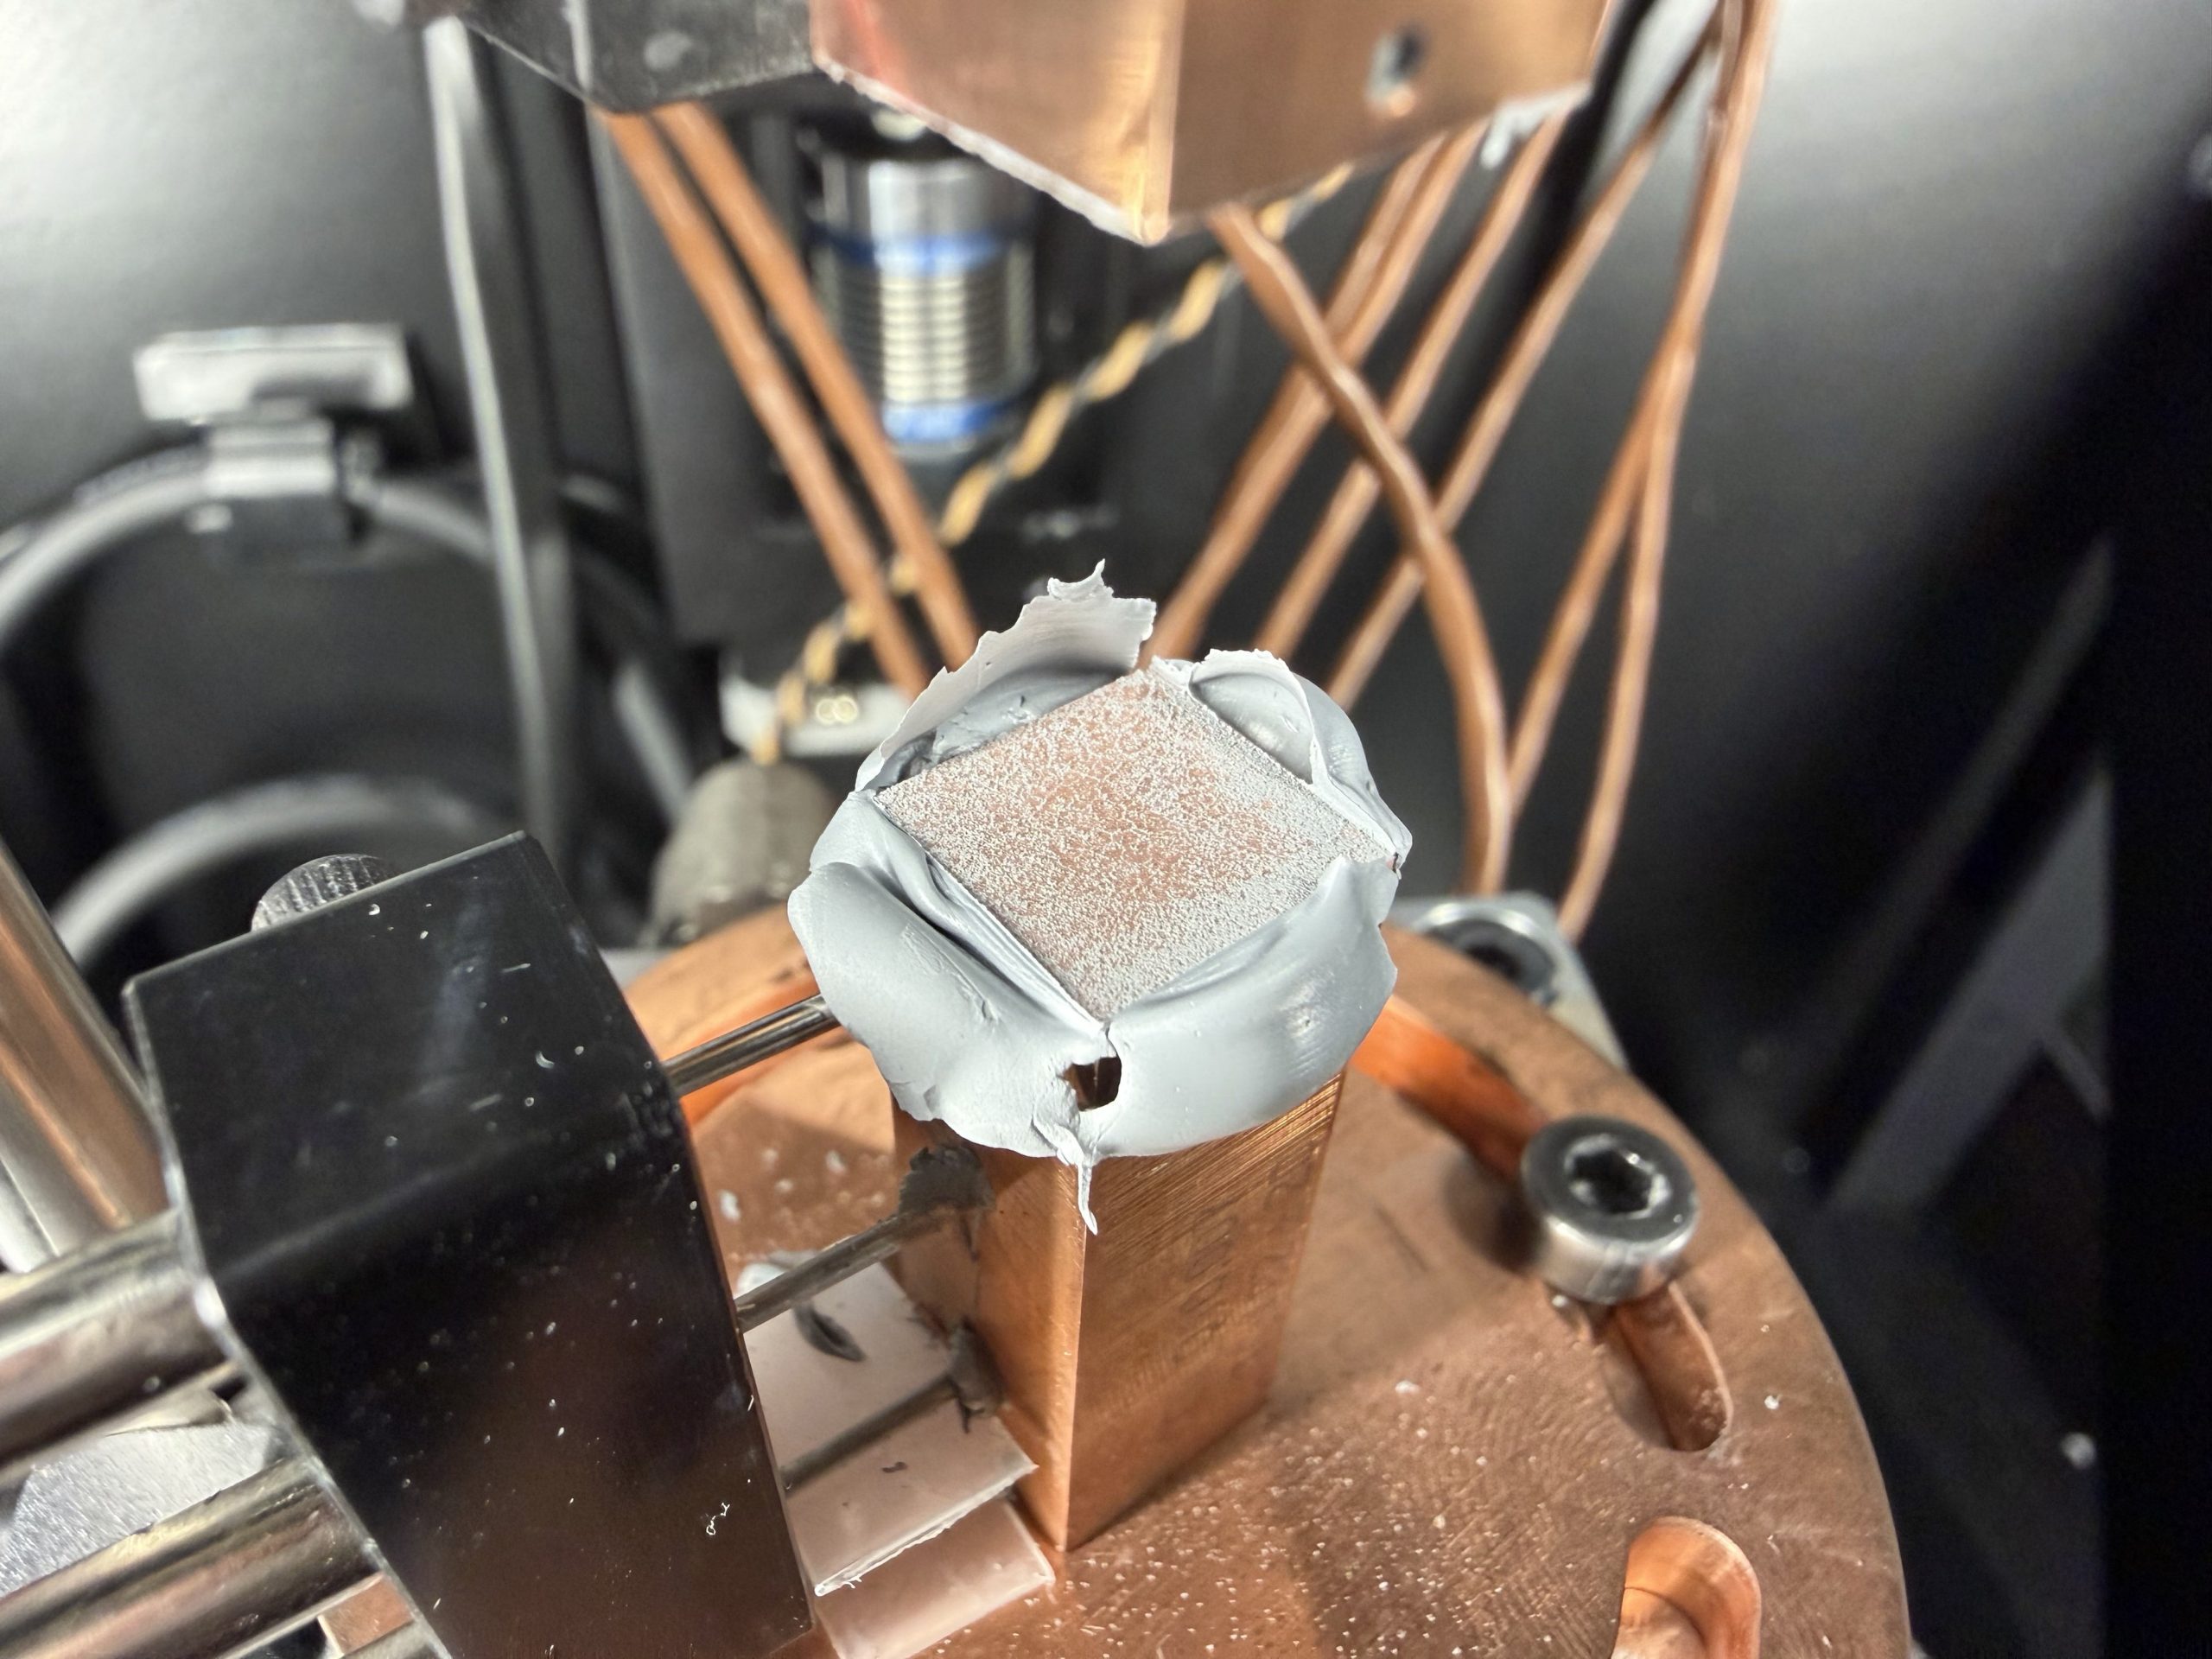
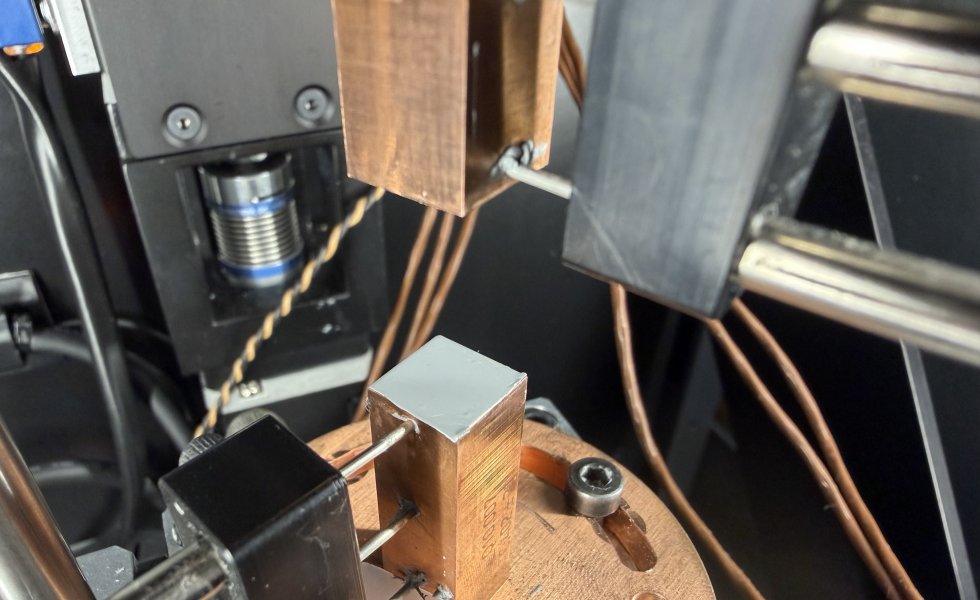
Parallel to this planned expansion of the thermal paste database, I have also extensively upgraded the TIMA5 measuring system together with the manufacturer Nanotest in order to achieve even more precise and reproducible measurement data in future. The previous setup reached its physical limits, particularly with high thermal loads and very conductive materials, as the temperature differences across the sample were sometimes too small due to thermal drifts in the micrometer range to be recorded accurately without additional measurement uncertainties. The heart of the upgrade is now a new heating block (heater) with exactly twice the performance of the previous version. This allows the heat flow to be driven in finely graduated stages into ranges that realistically reproduce even extreme GPU scenarios. In this way, the TIMA5 can now measure both low-conductive and highly conductive materials under exactly the same conditions without the measurement curve getting lost in noise or the temperature gradients becoming too small.
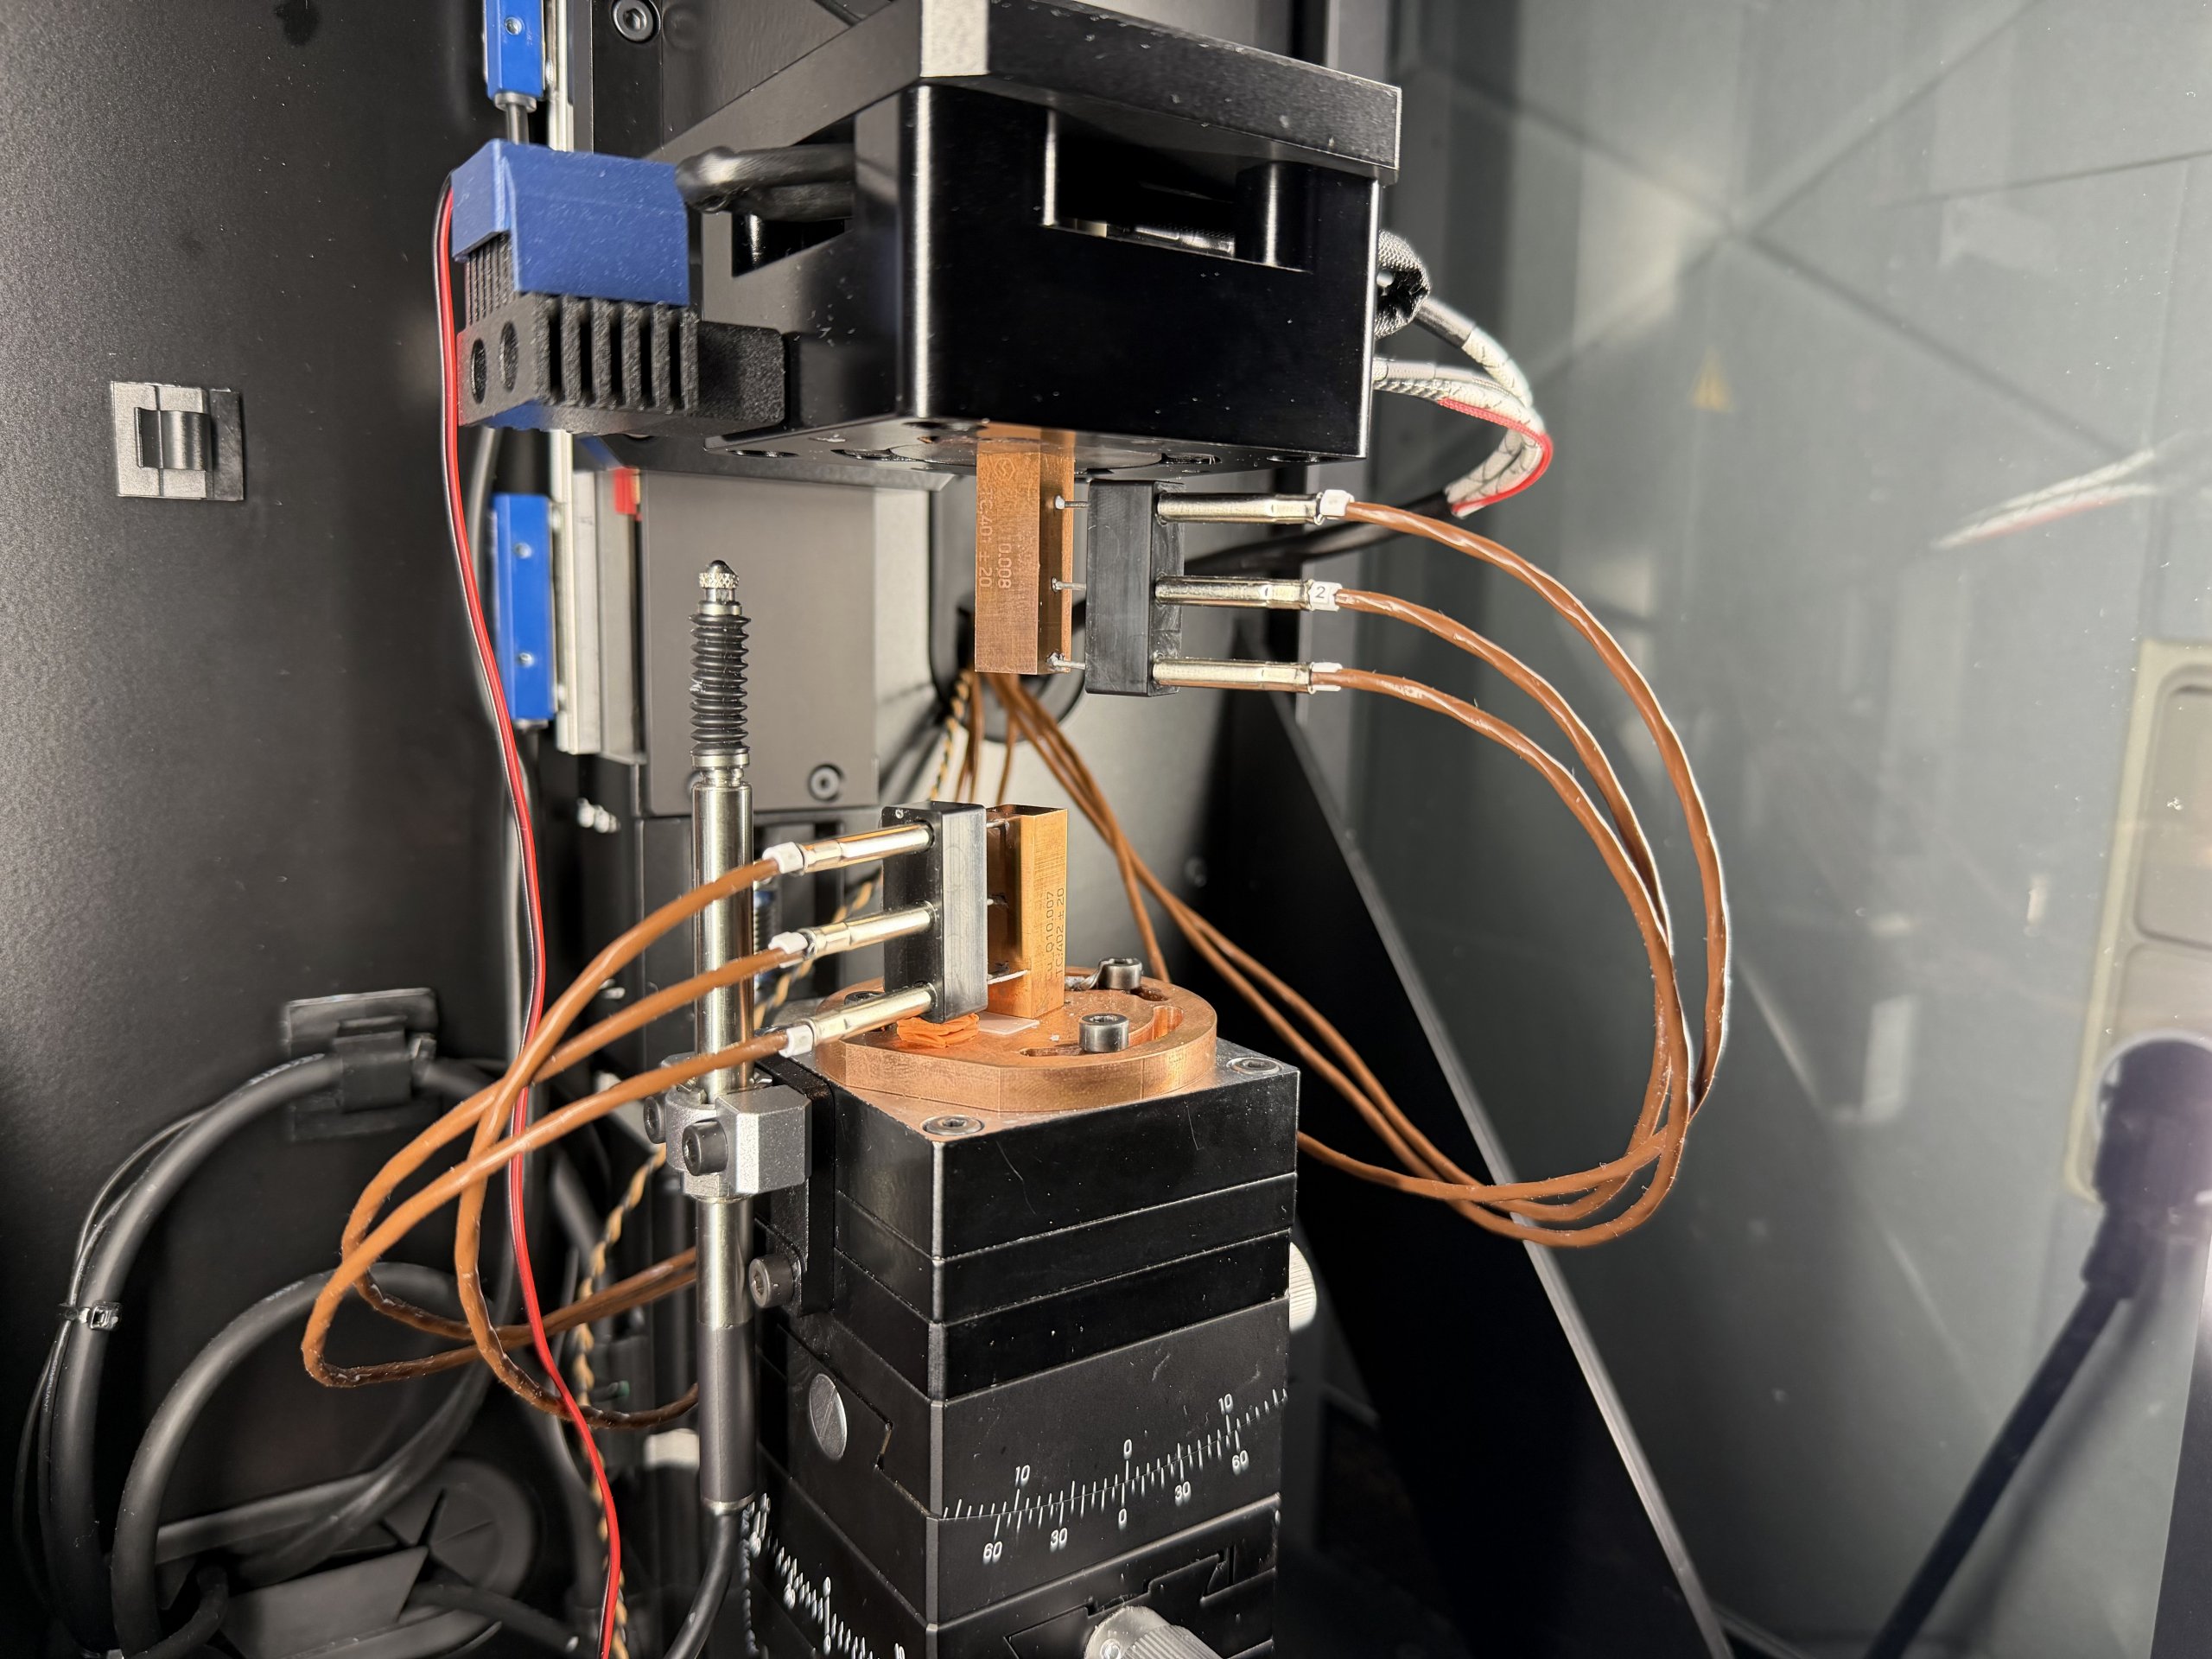
Equally important was the redesign of the sensor mounting. The temperature sensor was completely repositioned and mechanically and thermally decoupled so that it now has a thermally stabilized reference point (also with the aid of optional and experimental active cooling fan, see image). This additional cooling ensures that the sensor temperature remains constant even during longer high-load measurements and drift errors are virtually eliminated. The result of this modernization is cleaner calibrated and less noisy measured values, which now allow reproducible evaluation even with very thin and thinnest layers in the single-digit micrometer range and minimal temperature differences. This means that even the smallest differences between two high-quality pastes or pads can be clearly quantified, something that was only possible to a limited extent or in a roundabout way with the old TIMA5 version. In combination with the expanded database structure and the separate performance levels for CPU and GPU applications, this upgrade forms the basis for a new generation of thermal material tests, which no longer only focus on pure thermal conductivity, but also on the overall thermal behavior under realistic conditions,
| Test Setup and Methods | Material analysis and microscopy | Basic knowledge |


47 Antworten
Kommentar
Lade neue Kommentare
Urgestein
1
Urgestein
1
Urgestein
1
Veteran
Urgestein
Urgestein
Veteran
Urgestein
1
1
Veteran
Mitglied
1
1
Urgestein
1
Alle Kommentare lesen unter igor´sLAB Community →